Net revenue retention benchmarks (B2B SaaS)
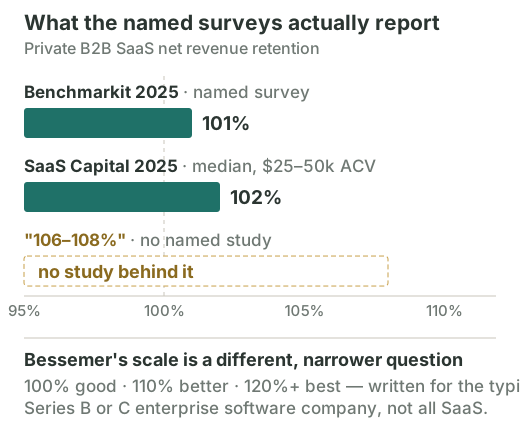
What's a good NRR? The two named surveys that publish a figure both land near 101-102% for private B2B SaaS, not the 106-108% that circulates. Dated, sourced, with the scope attached to each number.
Net revenue retention is the closest thing B2B SaaS has to a single health metric: above 100% and your existing customers grow your revenue on their own. It is also a metric where the number most often quoted is about five points too high, and where the most famous scale gets quoted with its scope stripped off.
The two named surveys that publish an NRR figure on their own sites both land near 101 to 102% for private B2B SaaS, not the 106 to 108% that circulates. Bessemer's familiar 100% good, 110% better, 120%+ best scale is real, but it was written for Series B to C enterprise software companies, so holding an SMB self-serve product to it is a category error.
The benchmark table
| Source | Figure | Scope — read this part | As of |
|---|---|---|---|
| Benchmarkit, 2025 SaaS Performance Metrics | 101% | Private B2B SaaS. Stated as a "Top Findings" figure, not labelled a median | 2025 |
| SaaS Capital annual survey | 102% median (111% top quartile, 97% bottom quartile) | Private SaaS >$1M ARR, $25k–$50k ACV band only | Sep 2025 |
| Bessemer, State of the Cloud | 100% good / 110% better / 120%+ best | The typical Series B or C enterprise software company | Apr 2023 |
| OpenView / High Alpha | ~120% vs ~110% | Usage-based pricing vs subscription-only peers | 2024 |
Two independent surveys, two different samples, ~101–102%. Graded Medium in our evidence ledger.
What NRR actually is
Most pages quote NRR benchmarks without defining NRR, which makes the benchmark useless: you cannot tell whether you are computing the same thing. SaaS Capital states its formula, so use theirs as the reference SaaS Capital:
Monthly recurring revenue in December of 2024 only from customers who were customers in December 2023, divided by total MRR in December 2023.
The cohort restriction is the whole point. NRR asks what happened to the revenue you already had: upgrades and expansion push it above 100%, downgrades and churn drag it below. New customers are deliberately excluded, which is why NRR above 100% means you would grow even if you sold nothing new.
Why the number you've seen is probably too high
Search this metric and you will be told the median is 106%, or 108%, depending on the page. Neither figure carries a named study, and the pages quoting them disagree with each other about what is nominally the same metric in the same year.
The surveys that publish a figure on their own site tell a more sober story. Benchmarkit's 2025 report states net revenue retention at 101%, noting that "retaining and expanding existing customers is becoming more challenging" Benchmarkit 2025. SaaS Capital's annual survey of private SaaS companies above $1M ARR reports a 102% median for the $25k–$50k ACV band, with the top quartile at 111% and the bottom at 97% SaaS Capital (Sep 2025).
Two different organisations, two different samples, two different methods, both landing at 101–102%. That is about as good as corroboration gets in this category, and it sits roughly five points below the figure in general circulation.
Bessemer's scale is real. Its scope is not optional.
You have seen 100% good, 110% better, 120%+ best. It is a genuine Bessemer figure, quoted verbatim from State of the Cloud 2023 Bessemer State of the Cloud 2023.
What gets dropped every time it is repeated is the sentence around it: these are targets for "the typical Series B or C enterprise software company" thinking about fundraising. It is a venture benchmark for enterprise software at a specific stage, not a universal scale for all SaaS.
That dropped qualifier does real damage. An SMB self-serve product with 105% NRR is doing well by the evidence above, and failing by a scale that was never aimed at it. Check the scope before you measure yourself against any of these numbers, including ours.
Read it against your own segment
NRR rises with contract value, and the reason is intuitive: bigger accounts have more seats, teams and products to expand into, and less of the involuntary churn that comes with small customers. SaaS Capital states the relationship directly — "higher net retention correlates with higher ACVs" — and its own band-level data shows it.
Be careful with the precise segment numbers, though. The neat split you will see quoted (118% enterprise, 108% mid-market, 97% SMB) is repeated across many pages as if it were established industry fact. It traces to a single vendor's unpublished internal dataset, with no linked study, no sample-selection criteria and no collection period. The direction is well supported. That particular triplet is not, so we don't publish it as a benchmark.
The one lever with evidence behind it
If you want to move NRR, the mechanism with the clearest data is pricing that expands on its own. Companies using usage-based pricing report roughly 120% median NRR against roughly 110% for subscription-only peers OpenView / High Alpha (2024), because expansion happens automatically as accounts use more rather than waiting on a sales-driven upsell. That is roughly twice the net expansion from the same customer base.
It is not free: usage-based revenue is harder to forecast and contracts down as fast as it expands. See usage-based vs per-seat pricing for the trade-off in full.
Related
Usage-based vs per-seat pricing covers the NRR lever and its costs, and what is usage-based pricing explains the mechanic. The Slack teardown is a worked example of expansion at the extreme: 143% net dollar retention at IPO, from a bottom-up motion. For the front half of the funnel, see free trial and PQL conversion rates.
Sources
- "2025 SaaS Performance Metrics," Benchmarkit. Net revenue retention at 101%. benchmarkit.ai
- "What is a Good Retention Rate for a Private SaaS Company?" SaaS Capital, 18 Sep 2025. Formula, ACV-band medians, >$1M ARR cohort. saas-capital.com
- "State of the Cloud 2023," Bessemer Venture Partners, 10 Apr 2023. The good/better/best scale and its Series B/C enterprise scope. bvp.com
- "SaaS Benchmarks 2024," OpenView / High Alpha. Usage-based vs subscription NRR. highalpha.com
We only quote NRR figures that appear on the publishing organisation's own site, and we attach the scope to every one of them. Two figures commonly found on this topic are excluded here: the "106–108% median", which we could not trace to any named study, and the "118/108/97%" segment split, which traces to a vendor's unpublished internal dataset. Both are logged with reasons in our evidence ledger. Your own cohort is the real benchmark.
Frequently asked questions
- What is a good net revenue retention rate for B2B SaaS?
- The two named surveys that publish an NRR figure on their own sites both land near 101 to 102% for private B2B SaaS: Benchmarkit reports 101%, and SaaS Capital reports a 102% median for companies with $25,000 to $50,000 annual contract values. That is meaningfully lower than the 106 to 108% widely quoted online, which has no named study behind it. Anything above 100% means your existing customers grow your revenue without any new logos.
- Is 100% good, 110% better and 120% best?
- That scale is real, but it is narrower than people think. It comes from Bessemer's State of the Cloud 2023, which frames those targets for the typical Series B or C enterprise software company navigating fundraising. It was not written as a universal SaaS scale. Measuring an SMB or self-serve product against an enterprise fundraising benchmark will make a healthy business look like it is failing.
- How is net revenue retention calculated?
- SaaS Capital publishes an explicit formula: monthly recurring revenue in December 2024 only from customers who were already customers in December 2023, divided by total MRR in December 2023. It captures upgrades, downgrades and churn from an existing cohort, and deliberately excludes new customers. Many pages quote NRR benchmarks without ever defining NRR, so check that you and your benchmark are computing the same thing.
- Does NRR vary by customer segment?
- The direction is real: SaaS Capital states that higher net retention correlates with higher annual contract values, which makes sense because larger accounts have more seats and products to expand into. Be careful with the precise numbers though. The widely repeated split of 118% enterprise, 108% mid-market and 97% SMB traces to a single vendor's unpublished internal dataset with no method disclosed, so treat it as an unverified figure rather than an established benchmark.
- How do I improve net revenue retention?
- The lever with the most evidence behind it is pricing that expands automatically with usage. Companies using usage-based pricing report about 120% median NRR versus about 110% for subscription-only peers, because revenue grows as accounts use more rather than waiting on a sales-driven upsell. Beyond pricing, NRR is mostly a product and customer-success outcome: accounts expand when more of the team depends on the product.
Related benchmarks
Activation rate benchmarks (B2B SaaS)
What's a good activation rate? There is no trustworthy cross-company benchmark, and here's the evidence why. Every product defines activation differently, so the figures circulating come from vendor pages with no method behind them.
Free trial conversion rate benchmarks (B2B SaaS)
What's a good free trial to paid conversion rate? Opt-in trials convert at a ~18.5% median; opt-out (card required) at ~48.8%. Dated, sourced ranges, with the honest caveats.
Freemium conversion rate benchmarks (B2B SaaS)
What's a good freemium to paid conversion rate? The median is ~2-5%, far lower than free trial, because a free tier is used indefinitely. Dated, sourced ranges.
Last fact-checked 2026-07-16. Every figure on this page maps to a primary source in our evidence ledger.