Activation rate benchmarks (B2B SaaS)
What's a good activation rate? There is no trustworthy cross-company benchmark, and here's the evidence why. Every product defines activation differently, so the figures circulating come from vendor pages with no method behind them.
If you came here for a number, the honest answer is that there isn't one worth having. Activation is the one metric on this site where the benchmark everyone quotes does not exist, and we think saying so plainly is more useful than repeating a figure we cannot trace.
There is no trustworthy cross-company activation-rate benchmark. Activation is defined per product, a different value event and a different time window at every company, so the figures that circulate (38% for B2B SaaS, a 36% average) come from vendor pages with no disclosed method. The useful move is to define your own activation event and benchmark yourself against your own last quarter.
Why an activation benchmark can't mean much
Trial-to-paid conversion has a shared definition: signups in, paying customers out. Everyone computes it roughly the same way, so a median is worth something.
Activation has no shared unit. Look at the three most-documented activation metrics in software and notice that they do not measure comparable quantities:
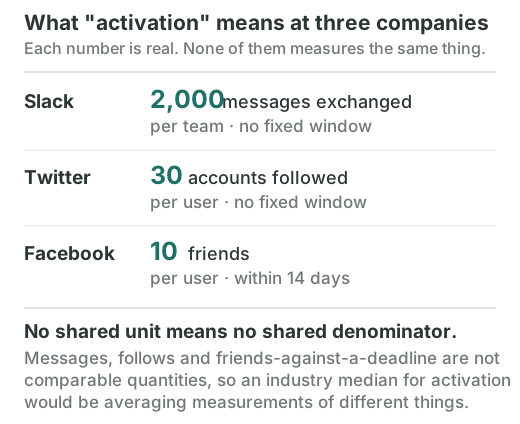
Messages, follows and friends-against-a-deadline are not the same quantity. An "activation rate" of 40% at a product whose value event is invited a teammate and one of 40% at a product whose value event is completed onboarding are two different facts wearing the same label. An industry median for activation is an average of measurements of different things.
What we actually checked
We went looking for the study behind each figure that ranks for this query. Here is what is behind them.
| The figure you'll see | Where it actually comes from | Does it hold up? |
|---|---|---|
| B2B SaaS 38% (also fintech 44%, e-commerce 62%, vertical SaaS 35%) | One vendor page, May 2026, citing "roughly 1,400 product organizations" | No. No collection method, no data date range, no selection criteria, no author byline, no dataset. Published by the vendor whose product it promotes. |
| SaaS activation averages 36%, median 30% | A vendor page citing two other blogs | No. No sample size or method for either source. The page itself concedes that percentile activation benchmarks "are not consistently published". |
| Amplitude's activation percentiles | Amplitude's Product Benchmark Report, 2,600+ companies | Real dataset, but it publishes no activation number in text and never defines activation. See below. |
A sample size with no methodology behind it is not a benchmark. "Roughly 1,400 product organizations" sounds like evidence right up until you ask which organizations, measured how, over what period, with activation defined as what, and no answer exists.
The best real dataset doesn't give you the number either
Amplitude's Product Benchmark Report is the largest public activation dataset we could find. Its methodology is genuine and disclosed: anonymized behavioral data from over 2,600 companies, spanning September 2023 to September 2024, with opt-outs excluded Amplitude Product Benchmark Report.
And it still does not answer the question. The report never defines "activation rate", and it presents activation only as a chart of 50th, 75th and 90th percentiles, with no numeric activation value stated anywhere in the text. The B2B technology figures it does state in text are for other metrics entirely: monthly acquisition of 0.3% at the median and 9% at the 90th percentile, and three-month retention of 2.5% at the median and 15.6% at the 90th percentile.
That is the whole finding in one line: when the best available data declines to state the number, pages confidently stating it to the percentage point are not drawing on better data. They are drawing on each other.
The famous numbers are rally cries, not constants
The activation numbers everyone quotes were never meant to travel.
Slack's is the best-documented. Stewart Butterfield's line was that "any team that has exchanged 2,000 messages in its history has tried Slack, really tried it" First Round Review, and roughly 93% of teams that passed that mark kept using it. That is a real threshold, found in Slack's own data, about Slack. It says nothing about your product.
Facebook's is the most-quoted and the least stable. The canonical retelling calls "7 friends in 10 days" Facebook's famous magic moment, but in that same account, the decision Alex Schultz attributes to Mark Zuckerberg is "get everyone to 10 friends in 14 days" — and the two numbers are never reconciled Alex Schultz, Khosla Ventures (Jun 2015). We are not going to tell you which one is right; we found no source that settles it. What Schultz does say is more useful anyway: the team saw "a strong correlation between number of friends and percent active", but "there was this huge conversation internally about whether it was causal or whether it was correlated." Zuckerberg ended the debate by picking a target, not by resolving it.
Mixpanel — an analytics vendor, arguing against its own category's favourite statistic — puts it bluntly: the number "could have been '10 friends in 12 days' or even 'five friends in one day'", because magic numbers "aren't entirely the output of some intense mathematical number crunching" Mixpanel (Jun 2026). Their point is that the value of the number is that it points the company at getting users to value fast, not that it is precise.
So when a page tells you the B2B SaaS activation benchmark is 38%, ask which value event those companies used. The question has no answer, which is why the number has no meaning.
What to do instead
Your activation rate is a real, useful number. It just isn't comparable to anyone else's, and the industry has been pretending otherwise because "there is no benchmark" makes for a worse blog post than "38%".
Related
See PQL conversion rates for the usage signals that tell you which activated users are worth converting, and what is a PQL for the definition. The Slack teardown covers where the 2,000-message metric came from and what Slack did with it. For metrics that do have shared definitions and real benchmarks, see free trial and freemium conversion rates.
Sources
- "The Product Benchmarks Every B2B Technology Company Should Know," Amplitude, 11 Dec 2025. 2,600+ companies, Sep 2023–Sep 2024. amplitude.com
- "From 0 to $1B — Slack's Founder Shares Their Epic Launch Strategy," First Round Review. The 2,000-message metric. review.firstround.com
- Alex Schultz on Facebook's magic moment, Khosla Ventures "Growth" talk, Jun 2015. startuparchive.org
- "Magic numbers are an illusion," Mixpanel, 2 Jun 2026. mixpanel.com
We tried to find a primary study behind every activation-rate figure ranking for this query and could not find one. The two most-cited numbers trace to vendor pages with no disclosed method; the one genuinely large dataset publishes no activation figure in text and never defines the metric. Rather than repeat a number we cannot stand behind, this page reports what is actually traceable. The figures we rejected, and why, are logged in our evidence ledger.
Frequently asked questions
- What is a good activation rate for B2B SaaS?
- There is no reliable cross-company answer. Activation is defined per product: each company picks its own value event and its own time window, so two activation rates are almost never measuring the same thing. The figures you will find quoted, such as 38% for B2B SaaS or a 36% average, come from vendor pages that disclose no data-collection method, no date range and no selection criteria. Benchmark your activation rate against your own previous quarter instead.
- Why is there no activation rate benchmark?
- Because activation has no shared unit. Slack's activation metric was 2,000 messages exchanged by a team, Twitter's was following 30 accounts, Facebook's was a friend count inside a two-week window. Messages, follows and friends are not comparable quantities, so an industry median for activation would be averaging measurements of different things. Conversion metrics like trial-to-paid have a shared definition; activation does not.
- Does Amplitude publish an activation rate benchmark?
- Not as a usable number. Amplitude's Product Benchmark Report is the largest public activation dataset, drawing on anonymized behavioral data from over 2,600 companies between September 2023 and September 2024. But it never defines activation rate, and it presents activation only as a percentile chart with no numeric value stated in the text. It does publish B2B technology figures for other metrics: monthly acquisition median 0.3%, and three-month retention median 2.5%.
- Was Facebook's activation metric really 7 friends in 10 days?
- The honest answer is that the canonical story does not hold together. The retelling that quotes Alex Schultz calls '7 friends in 10 days' Facebook's famous magic moment, but in the same account the decision Schultz attributes to Mark Zuckerberg is 'get everyone to 10 friends in 14 days', and the two numbers are never reconciled. Schultz also says the team never resolved whether friend count caused retention or merely correlated with it. Treat the exact threshold as a rallying cry, not a derived constant.
- How should I set my own activation metric?
- Pick the earliest action that reliably predicts a user sticking around, define the window you expect it to happen in, write both down, and hold them still. Slack chose 2,000 team messages because roughly 93% of teams that passed it kept using the product. The number matters far less than picking one, defining it precisely, and measuring the same thing every quarter.
Related benchmarks
Net revenue retention benchmarks (B2B SaaS)
What's a good NRR? The two named surveys that publish a figure both land near 101-102% for private B2B SaaS, not the 106-108% that circulates. Dated, sourced, with the scope attached to each number.
Free trial conversion rate benchmarks (B2B SaaS)
What's a good free trial to paid conversion rate? Opt-in trials convert at a ~18.5% median; opt-out (card required) at ~48.8%. Dated, sourced ranges, with the honest caveats.
Freemium conversion rate benchmarks (B2B SaaS)
What's a good freemium to paid conversion rate? The median is ~2-5%, far lower than free trial, because a free tier is used indefinitely. Dated, sourced ranges.
Last fact-checked 2026-07-16. Every figure on this page maps to a primary source in our evidence ledger.